Share this
Workflow Diagram - How to Create Workflow Chart
by Gary Fisher on August 3, 2021 6:23:00 AM EDT
First, what is a workflow?
A workflow, or a business process, can be defined as a collection of linked tasks (sequential or non-sequential) executed to achieve a particular business objective.
For example, for a factory manufacturing pencils, its business process is the set of tasks required to deliver the pencil to the consumer.
A business process or workflow must involve clearly defined inputs and a single output.
A workflow diagram, on the other hand, is a graphic overview of the business process. Without a proper visualization, it can be difficult to properly understand what’s happening in a process and analyze its efficiency. This is where a workflow diagram or workflow map comes in.
The workflow diagram will visually show the steps needed to complete the business process from beginning to end. We can also assign roles and responsibilities to the workflow diagram, so the diagram users can then view who is responsible for different tasks, improving transparency and accountability of the business process.
Ultimately a workflow diagram would enable us to perform workflow analysis to identify potential areas of improvement in the business process: inefficiencies, redundancies, bottlenecks, and others. We can also use the workflow diagram as the basis of a Standard Operating Procedure (SOP), for example, to teach new employees about the business process during onboarding.
Workflow Diagram and Flowchart
While there are different methods we can use to create a workflow diagram, most commonly, we use a flowchart or its variation (i.e., swim lane flowchart) to represent the business process graphically.
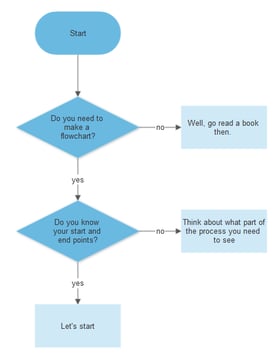
In a basic flowchart, or more accurately, an ANSI (American National Standards Institute) flowchart, we use different symbols and shapes to describe the various steps involved in the workflow.
There are many available symbols and shapes which may represent different elements of a process, but in a workflow diagram, there are four most important symbols:
Terminator: the oval shape represents the start and end points of a process
Operation: rectangle represents a specific task that is performed
Decision: diamond represents a point in the process where a decision must be made (i.e. Yes/No) before we can move on to the next step. 
Arrows: connecting different shapes in the process, representing the direction and flow of information
Then, what is a workflow?
These different shapes are used to represent the flow between each step, which belongs into one of these three workflow components:
-
Input: any asset (information, equipment, capital, human resource) that’s required to complete a certain step
-
Transformation: the changes experienced by the input that ultimately creates the output. The changes can be movements (between one location and another), changes in physical shapes/characteristics, changes in ownership, and so on.
-
Output: the result of this transformation.
Besides the ANSI basic flowchart method, as discussed, there are also other diagramming methods often used in creating workflow diagrams, and here are some of the popular ones that might be useful when mapping certain types of business processes:
- Swimlane chart: pretty similar to a basic flowchart, but different units are separated with vertical lines, just like the lanes in competitive swimming. This type of diagram is useful when different teams or departments are involved in the process to emphasize the interactions between teams.
- UML activity diagram: UML (Unified Modeling Language) Activity diagram is often considered a more advanced version of flowcharts and is especially useful in understanding the flow of programs and identifying constraints and conditions that cause particular events.
- BPMN diagram: The Business Process Modeling Notation (BPMN) diagram is quite similar to UML but focuses more on business-related information rather than the technicalities, such as internal processes involved within tasks.
- SIPOC diagram: SIPOC stands for Supplier-Input-Process-Output-Customer. This type of diagram is helpful to analyze the high-level process involved, especially data movements between different parties. SIPOC focuses on analyzing the most critical aspects of the workflow rather than the order of steps within the process.
Workflow Diagram: Why Do You Need One?
The workflow system was initially developed to improve efficiencies in the manufacturing industry but is now widely adopted in many different industries, and in general, the workflow diagram is used for three different purposes:
-
Workflow Analysis and Improvement Plan
By having an accurate visualization of the workflow, we’ll gain access to a bird’s-eye view of how a specific business process works. In practice, we can use the workflow map to identify potential areas of improvement (i.e., bottlenecks, redundant processes, outdated tools) to develop an accurate improvement plan to optimize the process.By improving the business process to become more efficient, we can use our resources better to achieve the business’s objectives, which may result in improved profitability.
-
Standardized Instruction for Process
Different workers may execute the same task in various ways with varying levels of efficiency and accuracy. Without a consensus on how to carry out a specific process, this can lead to confusion and inefficiencies, for example, when a new team member has arrived or when a senior member of the team leaves the organization.
With a standardized workflow diagram in place, everyone involved in the process can consult the workflow diagram for accurate, standardized instruction. -
Accountability and Transparency
With a workflow diagram in place and with the help of a workflow management software solution, we can monitor the execution of the business process in real-time. We can easily identify who is responsible for a specific task, the task's deadline, and other details.
Employees can also consult the workflow diagram to find out what their peers are currently working on and when the task will be passed to their end. This can help improve transparency in collaboration, and with more transparent accountability, everyone will be encouraged to be more productive.
Key Principles in Developing a Workflow Diagram
Below, we will discuss the step-by-step guide for mapping your workflow diagram.
The actual process of mapping a workflow might vary depending on various factors, especially the type of business process you are going to visualize.
However, when mapping any workflow diagram, we should always consider the following principles:
-
Start point and end point
It’s essential first to identify where the process starts and where/when it ends. Also, what conditions will determine whether the process successfully or unsuccessfully ends?
For some business processes, the start and endpoint might be obvious, but not for others. The best approach to accurately identify these is to ask the stakeholders directly involved with the process. -
Point of view and point in time
Determine whether you will map the workflow from your organization’s point of view or the customer’s point of view. For some processes, the two can be the same, but they will be vastly different for most.
Also, for workflow analysis purposes, you should map the workflow diagram as-is (visualizing how you are executing the process today). Still, for planning or other purposes, you might want to map the workflow diagram based on how you wish it to be in its ideal state (called to be diagram). Decide this based on the purpose of the workflow. -
List the steps accurately and completely
A workflow diagram is useless if it’s incomplete or inaccurate.
It’s crucial to understand that different employees and stakeholders might use different paths when executing the process. In practice, it can be very challenging to identify the most ‘correct’ approach.
A typical approach is to ask different stakeholders about their paths and identify the way that happens most often. Then, you can review the alternate ways of whether there are more efficient than the “typical” path. However, don’t get stuck too much in the different alternate paths. -
Identify decision points
Identify points in the business process that require validation or approval. Also, figure out what information/data is needed to decide and whether the information is readily available for the approver. This information will determine the requirements of this decision point.
Step-by-Step Guide to Creating Workflow Diagram
Again, while the actual process of mapping a workflow might vary depending on various factors, but while considering the four main principles above, here are the steps required to create a basic workflow diagram:
Step 1: Pick a business process
While the ultimate goal of the process might be to map all business processes in your organization, it’s best to focus on one at a time to maintain accuracy and integrity.
So, assuming your organization has more than one business process, which one should we pick?
The answer would vary depending on your organization’s purposes and priorities, but here are some key considerations you can use as a pointer:
-
Your primary business process, that is, the business process that contributes the most to your organization’s success, is a good candidate, especially if you’ve detected some inefficiencies.
-
Processes with obvious and noticeable bottlenecks and inefficiencies are also good candidates, depending on their impacts on your organization’s objectives.
-
If there’s any department or team that is repeatedly underperforming (i.e., missing deadlines), check for possible inefficient processes.
-
If the diagramming purpose is for onboarding, then pick the most crucial process for the specific new employees.
Suppose the purpose of the diagram is ‘only’ for onboarding new employees or standardizing the process. In that case, you might not need to include too many details, and you should only mainly focus on the accurate assignment of roles and responsibilities.
If, on the other hand, the purpose of the diagram is for workflow analysis and building an improvement plan, then you’ll need to be more in-depth for each step in the process.
Also, consider who’s going to have access to the workflow. If the workflow is available to external parties (i.e., clients), you shouldn’t include confidential or sensitive information in the workflow.
Step 2: Data Collection
The next step is to collect as much data related to the chosen business process as you can.
You should collect both quantitative and qualitative data.
Quantitative data, or hard data, is any data that can be measured in quantity.
For example, let’s say the process we will map is a design approval process in a creative agency. Then, the quantitative data we can collect can include:
-
The number of design deliverables that must be approved at any given time
-
The number of revisions at any given time
-
The ratio between approved and rejected design at any given time
Qualitative data, or soft data, is data that cannot be measured, for example:
-
What tasks are involved in each step of the business process
-
Who’s in charge of a specific task
-
The timeline of the process
-
Possible variations of the execution paths (as discussed above)
To collect this information, interview as many stakeholders as possible, and don’t be afraid to ask as many questions as needed.
Step 3: Draft The Workflow Diagram
Now that you’ve collected enough data, you can start creating a draft for the workflow diagram. A workflow management solution like Approve with its workflow builder tool can help you visualize the workflow diagram.
Again, consider the four main principles we’ve discussed above when creating your draft. Determine what point of view you are diagramming for: your organization or your customers, and whether it will be an as-is or workflow diagram.
Our tip is to start with the different symbols and shapes first and ignore the arrows/connectors. Once you are sure about the placements and sequence of the shapes, you can put in the arrows.
Step 4: Revising Your Workflow Diagram
The next step is to involve your stakeholders and dive into the details of the workflow diagram.
Interview the stakeholders and team members. If this is an as-is diagram, your objective is to make sure the workflow diagram is as accurate as possible. If it’s a workflow diagram, you should collect feedback from stakeholders about their ideal versions of the processes since it can vary significantly between different stakeholders.
For an as-is workflow diagram, you should confirm the following details and make sure they are accurate:
-
The overall goal of the workflow/process
-
What action triggers the start of the process, and what signals the end of the process
-
The tasks involved in each step of the process
-
Who is responsible for completing each task
-
Potential variations from this process
-
For any decision points, what information is needed to make a decision
Step 5: Workflow Analysis
If the purpose of the workflow diagram is to standardize a process or for onboarding, you can skip this step.
Now that we’ve got a complete version of the workflow diagram, we can conduct a workflow analysis to create an improvement plan.
The actual analysis process might vary depending on the workflow itself, but most likely, the goal is to identify and eliminate inefficiencies. We can do so by performing these three steps:
Prioritize different tasks and steps in the process based on their impacts. You can, for example, categorize the tasks into four other ranks: very important, important, nice to have, and redundant. Divide different tasks by roles/job descriptions to make categorization easier.
Look for redundancies, inefficiencies, bottlenecks, and any inefficient steps that slow down the process. Check whether the tasks and steps have aligned well with the business process’s objectives, as well as your organization’s overall objective.
Look for automation opportunities. The general rule of thumb is that if it’s cost-effective enough to automate a step, we should go for it as it will dramatically improve the process’s efficiency and consistency.
Based on these findings, you should create a comprehensive improvement plan for the workflow.
Step 6: Implement Changes and Review
Based on the improvement plan you’ve developed above, the next step is to implement the changes.
Once changes get implemented, we should again involve stakeholders to confirm whether the changes implemented do generate positive effects. Getting feedback from stakeholders will also help in ensuring the accuracy of the workflow diagram.
It’s crucial to remember that even after the improvements, the workflow will not be perfect, and we should expect to analyze and improve the workflow diagram in the future continuously.
Closing Thoughts
A workflow diagram will provide us with an accurate representation of a business process, which will, in turn, allow us to perform precise workflow analysis to devise an improvement plan.
With the help of workflow analysis and management tools like Aproove, you can generate a workflow map and get all the data you need in a single platform, making the analysis more time and cost-effective.
A workflow diagram will provide us with an accurate view of all tasks and steps in the business process, allowing us to identify bottlenecks and redundancies and implement automation when possible to improve the process’s efficiency in achieving its objectives.
Share this
- Project Management (40)
- Online Proofing (28)
- Featured (27)
- Educational (25)
- New Release (25)
- Work Management (25)
- Business Workflow (23)
- Marketing management (22)
- Workflow Management (22)
- BPM Software (20)
- Marketing Workflow (20)
- Business Automation (19)
- Newsletter (19)
- Workflow Automation (17)
- Marketing Automation (14)
- enterprise project management (10)
- business process workflow (8)
- BPM (7)
- Task Management (7)
- Aproove news (6)
- Digital Asset Management (6)
- News (6)
- insurance work management (5)
- team (5)
- Industry News (4)
- business process automation (4)
- insurance marketing (4)
- marketing process (4)
- Compliance (3)
- Retail Marketing (3)
- brands (3)
- enterprise workflow management (3)
- printing workflow (3)
- AI (2)
- Document Management Automation (2)
- IT Project Management (2)
- Marketing Agency (2)
- Product Development (2)
- creative workflow (2)
- print (2)
- workflow optimization (2)
- Case Studies (1)
- Case Study (1)
- DAM Software (1)
- Document Workflow Automation (1)
- HIPPA (1)
- Healthcare (1)
- ISO (1)
- Insider (1)
- Resource Management (1)
- SOC2 (1)
- SaaS (1)
- banking (1)
- marketing teams (1)
- security (1)
- workflow diagram (1)
- workflow process mapping (1)
- workflow software (1)
- April 2025 (6)
- March 2025 (11)
- February 2025 (10)
- January 2025 (10)
- December 2024 (9)
- November 2024 (10)
- October 2024 (5)
- September 2024 (8)
- August 2024 (10)
- July 2024 (9)
- June 2024 (11)
- May 2024 (6)
- April 2024 (7)
- March 2024 (7)
- February 2024 (6)
- January 2024 (4)
- December 2023 (3)
- November 2023 (7)
- October 2023 (7)
- September 2023 (3)
- August 2023 (5)
- July 2023 (3)
- June 2023 (1)
- May 2023 (1)
- April 2023 (1)
- February 2023 (2)
- September 2022 (3)
- August 2022 (1)
- July 2022 (1)
- May 2022 (1)
- March 2022 (3)
- February 2022 (3)
- January 2022 (3)
- November 2021 (2)
- October 2021 (2)
- September 2021 (1)
- August 2021 (4)
- July 2021 (4)
- June 2021 (2)
- May 2021 (3)
- April 2021 (1)
- February 2021 (1)
- November 2020 (1)
- October 2020 (2)
- July 2020 (4)
- June 2020 (2)
- May 2020 (2)
No Comments Yet
Let us know what you think